U . S . C E N S U
S O F P O P U L A T I O
N & H O U S
I N G
Weston, Connecticut, Census Block
Numbers 2000 - as
local as you can get...

WESTON, CONNECTICUT POPULATION
CHANGE: Quick links to information...and the 2010 Census data as it gets released!

Connecticut State Data Center at
UCONN

U.S.
Census/New England City and Town Areas 2006

Link
to the U.S. CENSUS BUREAU
WESTON, CT CENSUS GEOGRAPHY: U.S.
CENSUS 2000 BLOCK GROUP MAP
AT THE VERY TOP OF THIS PAGE is a U.S. Census 2000 map
of the census tracts and block groups in Weston, CT. In yellow is
the census block group for an address in the northern part of
Town.
NOTE: there are two census tracts in Weston (551 and 552). In
each
tract there are three census block groups. More detail is
available
for smaller units--blocks--not shown here, but in Weston, census
geography
gets complicated, as lines are draw from tree to tree (a slight
exageration)...below
is a sample table, courtesy of the South Western Regional Planning
Agency's
data guy, no longer working at SWRPA.
|
Sample
Population Density Query
|
|
SUMLEV
|
NAME
|
AREALAND
|
Area
(sq mi)
|
Population
|
Population
Density
|
|
060
|
Weston
town
|
51278488
|
19.7987357470382
|
10037
|
506.95156136429
|
|
070
|
Georgetown
CDP (part)
|
420758
|
0.162455578944767
|
144
|
886.396151707157
|
|
080
|
Census
Tract 551 (part)
|
420758
|
0.162455578944767
|
144
|
886.396151707157
|
|
085
|
Urban
|
420758
|
0.162455578944767
|
144
|
886.396151707157
|
|
090
|
Block
Group 1 (part)
|
420758
|
0.162455578944767
|
144
|
886.396151707157
|
|
070
|
Remainder
of Weston town
|
50857730
|
19.6362801680934
|
9893
|
503.812326739711
|
|
080
|
Census
Tract 551 (part)
|
34180165
|
13.1970360480435
|
5528
|
418.881935297855
|
|
085
|
Rural
|
16543324
|
6.38741337797704
|
1182
|
185.051433194441
|
|
090
|
Block
Group 1 (part)
|
16543324
|
6.38741337797704
|
1182
|
185.051433194441
|
|
085
|
Urban
|
17636841
|
6.80962267006642
|
4346
|
638.214510637137
|
|
090
|
Block
Group 1 (part)
|
10232179
|
3.9506665667949
|
2478
|
627.235925407482
|
|
090
|
Block
Group 2
|
4473417
|
1.7271960333407
|
1199
|
694.188717930835
|
|
090
|
Block
Group 3
|
2931245
|
1.13176006993083
|
669
|
591.114687445096
|
|
080
|
Census
Tract 552
|
16677565
|
6.43924412004998
|
4365
|
677.874595002328
|
|
085
|
Rural
|
59212
|
2.28618819855536E-02
|
0
|
0
|
|
090
|
Block
Group 1 (part)
|
59212
|
2.28618819855536E-02
|
0
|
0
|
|
085
|
Urban
|
16618353
|
6.41638223806442
|
4365
|
680.28989515387
|
|
090
|
Block
Group 1 (part)
|
5562466
|
2.14768022091222
|
1360
|
633.241386104652
|
|
090
|
Block
Group 2
|
3330853
|
1.28604958787454
|
989
|
769.021668623623
|
|
090
|
Block
Group 3
|
7725034
|
2.98265242927766
|
2016
|
675.908456584139
|
|
140
|
Census
Tract 551
|
34600923
|
13.3594916269882
|
5672
|
424.567053774837
|
|
150
|
Block
Group 1
|
27196261
|
10.5005355237167
|
3804
|
362.267237838319
|
|
150
|
Block
Group 2
|
4473417
|
1.7271960333407
|
1199
|
694.188717930835
|
|
150
|
Block
Group 3
|
2931245
|
1.13176006993083
|
669
|
591.114687445096
|
|
140
|
Census
Tract 552
|
16677565
|
6.43924412004998
|
4365
|
677.874595002328
|
|
150
|
Block
Group 1
|
5621678
|
2.17054210289777
|
1360
|
626.571582363842
|
|
150
|
Block
Group 2
|
3330853
|
1.28604958787454
|
989
|
769.021668623623
|
|
150
|
Block
Group 3
|
7725034
|
2.98265242927766
|
2016
|
675.908456584139
|
|
158
|
Census
Tract 551 (part)
|
420758
|
0.162455578944767
|
144
|
886.396151707157
|
|
393
|
Weston
town
|
51278488
|
19.7987357470382
|
10037
|
506.95156136429
|
|
397
|
Weston
town
|
51278488
|
19.7987357470382
|
10037
|
506.95156136429
|
|
441
|
Weston
town (part)
|
34675952
|
13.3884604870756
|
8855
|
661.390456994519
|
|
451
|
Georgetown
CDP (part)
|
420758
|
0.162455578944767
|
144
|
886.396151707157
|
|
451
|
Remainder
of Weston town (part)
|
34255194
|
13.2260049081308
|
8711
|
658.626702508239
|
|
511
|
Census
Tract 551
|
34600923
|
13.3594916269882
|
5672
|
424.567053774837
|
|
511
|
Census
Tract 552
|
16677565
|
6.43924412004998
|
4365
|
677.874595002328
|
|
521
|
Weston
town
|
51278488
|
19.7987357470382
|
10037
|
506.95156136429
|
Fixing the Census
NYTIMES
By Alan B. Krueger (Alan B. Krueger is an economics professor at
Princeton).
January 26, 2009, 6:31 am
Serious problems in the planning for the 2010 census have been in the
news lately. The census has fallen well behind schedule because of
technology glitches, and as a result the Government Accountability
Office has listed the population count as one of the 13 urgent issues
requiring immediate attention in the first year of the new presidential
administration, up there with homeland security and Iraq. Without
urgent action to prepare and test survey procedures, the 2010 census
will miss more people than the 2000 census...full story here.
Data Show Steady Drop in Americans on Move
NYTIMES
By SAM ROBERTS
December 21, 2008
Despite the nation’s reputation as a rootless society, only about one
in 10 Americans moved in the last year — roughly half the proportion
that changed residences as recently as four decades ago, census data
show.
The monthly Current Population Survey found that fewer than 12 percent
of Americans moved since 2007, a decline of nearly a full percentage
point compared with the year before. In the 1950s and ’60s, the number
of movers hovered near 20 percent. The number has been declining
steadily, and 12 percent is the lowest
rate since the Census Bureau began counting people who move in
1940. An analysis by the Pew Research Center attributes the
decline to a
number of factors, including the aging of the population (older people
are less likely to change residences) and an increase in two-career
couples.
The Pew analysis is drawn from census data and a survey, which found
that 63 percent of Americans said they had moved to another community
at least once in their lives, while 37 percent said they lived in the
community where they were born.
According to the census’s American Community Survey, New York retained
first place in the proportion of residents who were born in the state —
more than 81 percent — with upstaters generally less mobile. The
top five also included Louisiana, Pennsylvania, Michigan and Ohio,
generally Rust Belt states with older populations.
In contrast, fewer than 14 percent of Nevadans and 28 percent of
Arizonans were born in those states.
Measuring the percentage of people born in a state who still live
there, Texas ranked first, with nearly 76 percent, followed by North
Carolina, Georgia, California and Wisconsin. Alaska recorded the
smallest share of people born in the state and
still living there, 28 percent, followed by Wyoming, the Dakotas and
Montana.
The telephone survey of 2,260 adults in October found that 57 percent
had never moved outside their home state, while 15 percent had lived in
four or more states.
About 23 percent say their current home is not where their heart is —
typically because they were born someplace else, where they lived
longer or their family still resides. About half who identify home as
someplace else want to stay put; 40 percent say they would like to
return. Most people who do not move are kept close to home by
family ties, the
survey found, while most who do move are drawn by better jobs.
The Pew survey found that among all foreign-born adults, including
recent arrivals, 38 percent describe home as their country of birth.
Among those who have lived in the United States 20 years or more, 76
percent describe America as home.
Population
loss is threat to our state
Stamford ADVOCATE
Staff Reports
Article Launched: 07/12/2008 02:39:30 AM EDT
Get ready for some competitive congressional races in Connecticut soon
after the 2020 Census. That's the time officials say the state is
likely to lose one of its five remaining U.S. House seats - we
originally had six - and with it one of its seven electoral votes.
The state showed growth over the past year that could charitably be
called "anemic." The population rose 0.19 percent in the past year, the
equivalent of adding about 6,500 people. In a state of almost 3.5
million, that's almost like going backward.
A multigenerational trend is emptying out the Northeast and filling up
the West, specifically places like Arizona, Colorado and Nevada. Those
states stand to pick up the congressional seats, and the national
clout, that Connecticut and its neighbors appear on track to lose.
None of this is a surprise. However, it was only recently that
Connecticut had six seats in the House, losing one after the 2000
Census. To drop another one so soon would no doubt increase pessimism
about our state's economic viability.
Officials like Gov. M. Jodi Rell and the mayors of Stamford and Norwalk
challenged the idea that Connecticut is in a downward spiral, saying
the state and its cities are either holding their own or poised for a
comeback. Stamford Mayor Dannel Malloy said an increase in housing
stock has his city on a path for population growth. Mayor Richard
Moccia, meanwhile, said the same of Norwalk's redevelopment plans.
But the nationwide mortgage crisis has put a serious crimp in the
state's housing market.
The reasons for the statewide lack of growth are legion, but not easy
to change. Connecticut is expensive, for people and businesses. There's
little to keep young people here. The weather is nice for a few months,
but why settle for that when you can get year-round sun? If we're not
careful, the Land of Steady Habits will become the Land of Rich and Old
People. Most of the places in Connecticut where people would like to
live - i.e., in close proximity New York City - are far out of reach
for most people wishing to buy a home, or even obtain an affordable
rental unit. In much of our region, the housing slump has not caused a
significant reduction in average home prices.
The warning signs for Connecticut are there. No one will be able to say
we didn't see it coming. But time is running short to take effective
action to halt if not reverse these trends. Job retention and creation
must be a major focus involving cooperative efforts by state and local
officials. That should include a rigorous review of state taxing
policies, as well as the state spending that drives them. Affordable
housing, a topic that produces a lot of talk but little progress, needs
to be confronted too.
Connecticut ignores these concerns at its economic and political peril.
Estimate
from State Data Center at UCONN...
Growth stalls in the state
Stamford ADVOCATE
By Kate King, Special Correspondent
Article Launched: 07/11/2008 01:00:00 AM EDT
Fairfield County saw a small increase in population despite a drop
statewide, according to census figures released yesterday.
Stamford, Greenwich, New Canaan, Darien and Westport all saw minor
increases, according to the data. Norwalk posted a decline of 0.1
percent. But the statewide picture isn't promising, experts say,
pointing to a shrinking work force, loss of jobs, an aging population
and a potential reduction in state representation in Washington, D.C.
"This population growth is consistent with our slow growth in the
recent past," said Lisa Mercurio, director of the Business Council of
Fairfield County. "New England as a whole has been growing more slowly
than the rest of the U.S."
The population in Connecticut rose 0.19 percent over the last year,
according to the census data. Connecticut's population growth is
the eighth lowest in the nation, according the report. Nevada had the
highest growth rate since 2006 at 2.9 percent, and Rhode Island had the
lowest at minus 0.36 percent.
Within Connecticut, Milford's population grew the most, by 532 people.
Bridgeport showed the biggest population decline, losing 252 people
over the past year.
Though 35 percent of the state's 169 towns declined in population,
Fairfield County's population grew 0.1 percent. Stamford and Darien's
population grew by 0.1 percent, and Greenwich and Westport grew by 0.4
percent. New Canaan's population increased by 0.5 percent.
Local leaders remained optimistic. Despite the city's losses,
Norwalk Mayor Richard Moccia said the city's redevelopment plans put
Norwalk on a course toward growth.
"From a statistical point of view, in my mind it's virtually no loss
whatsoever, so I'm not worried," he said. "I don't see this as a threat
to our economic viability. I think with our new development projects in
place, with more affordable housing going in down the road, you might
see an increase in population."
Stamford Mayor Dannel Malloy painted an equally bright picture,
estimating a 10-year growth rate of 6 percent for the city, coming from
an increase in housing stock. Malloy also suspected that the
census counts miss some of the city's population.
"As much as I think these reports are interesting. . . . I respectfully
would argue that it probably undercounts our immigrant population,"
Malloy said.
The slow statewide growth comes on the heels of a population boom,
which lasted from 1995 to 2003, said Orlando Rodriguez, demographer and
manager of the Connecticut State Data Center. The population
growth during those eight years was abnormal, a reaction to the end of
a deep economic recession that took place in Connecticut from 1990 to
1995.
The population growth rate that Connecticut has experienced since 2004
is "more normal, looking forward, than what happened between 1995 and
2003," Rodriguez said. But the return to normal of Connecticut's
population growth rate isn't necessarily a good thing for the state.
"One of the things that's concerning us is that we're seeing a decline
in population in urban areas, which is counter to what we had
expected," he said.
A declining urban population means a smaller work force to replace the
growing elderly population in the state, Rodriguez said.
Connecticut has one of the nation's oldest populations, meaning a high
number of senior citizens.
Before the 2007 census, demographers had projected a job loss of 60,000
workers by the year 2030, he said. However, if urban areas continue to
lose population, that worker loss will be even greater. Also
contributing to the slow growth rate in Connecticut is a net loss of
population to other states.
"We send more people to other states than we get from other states,"
Rodriguez said. "You've got a lot of elderly people, not a lot of
children being born, and folks leaving - it's lucky Connecticut has any
population growth at all."
The only reason Connecticut has not dipped into negative population
growth is the 15,000 foreign immigrants who have been coming to the
state yearly since 2004. In addition to contributing to a decline
in the work force, slow population growth could cut Connecticut's
representation in Congress.
"By 2020 we will lose a congressional seat," Rodriguez said. "For 2010,
we'll probably be OK unless the bottom really falls out and Connecticut
goes into major population loss."
Although Connecticut will most likely remain a five-district state for
the next 12 years, uneven population growth within the districts will
probably force a redrawing of the districts before then, he said.
2010
Census: Who Should Count?
By
MICHAEL REGAN | Courant Staff Writer
September 30, 2007
Border states in America's South and West are battlegrounds in the
debate over illegal immigration, but when it's time to pass out seats
in Congress, they are beneficiaries as well, a new study says.
Because of their large populations of undocumented residents, Texas and
Arizona will each get one extra seat in the U.S. House of
Representatives after the 2010 Census, the Connecticut State Data
Center projects in a report being released today. California will keep
two seats it otherwise would have lost.
Overall, the South and West each stand to gain five seats in the House,
the center at the University of Connecticut says. If it weren't for
their populations of illegal immigrants, each of these regions would
gain only three.
The big loser in the reapportionment will be the Midwest, the center
says. Five states in that region are projected to lose a total of six
seats, four more than they would have if illegal immigrants were not
included in the census tally.
Connecticut, which lost a seat in the last reapportionment, should keep
the five it now has, but the Northeast as a whole will lose four - two
in New York and one each in Massachusetts and Pennsylvania.
There's more than congressional clout at stake in the reapportionment:
It also helps determine the makeup of the Electoral College. And the
census itself influences everything from federal aid to the makeup of
state legislatures. So as the 2010 Census approaches, attention is
turning to the issue of whether it's fair to continue counting illegal
immigrants.
Orlando J. Rodriguez, manager of the Connecticut State Data Center and
author of the new report, considered that issue when designing the
study. He figured the reapportionment two ways - one in which all
residents are counted, as is currently done, and one in which illegal
immigrants are factored out. Although politics watchers have been
handicapping the 2010 reapportionment almost since 2000 was completed,
Rodriguez said this is the first study he knows of to factor in the
immigration question.
In part, the shift expected in 2010 is the result of a long-term
population trend that has states in the South and West growing far
faster than states in the Northeast and Midwest. In the 1960s, the
Northeast and Midwest had 233 seats in the House, the South and West
202. The numbers roughly reversed two decades later, and now stand at
183 to 252. The new CSDC report projects that the South and West will
have 262 seats to 173 for the Northeast and Midwest after 2010.
The winners and losers don't fall strictly along regional lines. New
Jersey, for example, with the highest proportion of undocumented
workers in the Northeast, would lose one seat if illegal residents were
not counted, according to the CSDC projection. Montana would gain a
seat if they weren't counted. Louisiana, in the wake of Hurricane
Katrina, is expected to lose a seat regardless.
The new report suggests that the country's illegal immigrant population
is playing an increasing role in congressional apportionment. After the
2000 Census, an analysis by the Center for Immigration Studies found
that illegal immigrant populations affected the apportionment of four
seats. The CSDC report projects that six seats will be affected by
undocumented residents after 2010.
The projections are based on the most reliable data available,
Rodriguez said, but studying the undocumented residents population is
imprecise at best.
"Nobody really knows for sure," he said. "The bottom line is not `Is
this specifically going to happen?' What I was trying to get across is,
`Look at the impact [illegal immigration] is having.'"
Steven A. Camarota, director of research at the Center for Immigration
Studies, said the impact is cause for concern. "You can make a strong
case that there is a fundamental unfairness about this," Camarota said.
"You do raise competing questions of fairness, justice, one man-one
vote."
Counting illegal immigrants gives some voters disproportionate
political clout. For example, Montana, which missed out on an
additional seat after 2000 because of the weight of illegal immigrants
elsewhere and is projected to fall short again after 2010, had almost
650,000 registered voters last November and one representative in
Congress.
By contrast, California, which would lose two of its 53 seats after
2010 if illegal immigrants weren't counted, according to the
projections, has four districts each with fewer than 200,000 voters
registered. One district has fewer than 170,000 voters.
"You can win election [to Congress] in California with less than 50,000
votes," Camarota said.
But that's beside the point, said Arturo Vargas, executive director of
the National Association of Latino Elected and Appointed Officials. The
size of the electorate has nothing to do with representation in
Congress.
Members of Congress "are elected to represent constituents. They don't
just represent citizens," Vargas said. "They don't just represent the
people who vote for them. They represent everybody in that
congressional district."
Vargas said the framers of the Constitution drew distinctions among
various classes of residents at various points. When it came to
apportioning seats in Congress, he said, everyone was counted -
although slaves were only counted as three-fifths of a person. "Would
we go back to a time when we considered a person here to be less than
human, less than a whole person?" he said.
At a time when illegal immigration in general is under heightened
scrutiny, its connection to the census and reapportionment is likely to
get renewed attention. One question that has already come up is how
immigration enforcement might affect the count.
In 2000, the then-Immigration and Naturalization Service suspended
raids before and after the census so as not to deter undocumented
residents from responding. Earlier this year, when a census official
raised the possibility of a similar freeze in 2010, a spokesman for
Immigration and Customs Enforcement firmly ruled out the possibility.
Camarota and Vargas agreed that the question of what ICE does in 2010
depends on who is elected president in 2008.
"Under the unlikely circumstance that the Republicans win and they
institute a comprehensive enforcement strategy, who knows?" Camarota
said. "It could reduce the number of illegals significantly, and it
could reduce the response rate."
But Vargas said the Constitution charges the government with counting
everyone in the census.
"So the federal government needs to have some common sense about what
its other agencies are doing that is going to compromise its
constitutional duty to enumerate all persons," he said.
The other question is whether there will be renewed efforts to keep
undocumented residents - or all noncitizens - out of the
reapportionment count. Anti-illegal immigrant groups and states losing
representation have been unsuccessful in court over the issue in the
past, and Rep. Candice Miller of Michigan, which lost one seat after
2000 and is projected to lose another after 2010, has proposed a
constitutional amendment to limit the reapportionment count to citizens.
Margo J. Anderson, a professor of history at the University of
Wisconsin-Milwaukee and author of several books and papers on the
census and reapportionment, said it's hardly a new question.
"It's an old issue. It goes back to 1790," she said. "Every time there
is in some sense a political crisis in the country or a sectional
dispute, the communities that think they're not going to gain from it
take a hard look at it and wonder whether the rules are fair."
Census: Shifting Growth
Patterns Immigration A Powerful Force
By
MICHAEL REGAN, Courant Staff Writer
March 22, 2007
If the immigration controversy can be said to have an epicenter in
Connecticut it would be Fairfield County, where anti-immigrant forces
have made issues of Ecuadorean basketball games in Danbury, worker
pickup zones in Stamford and Latino employment at fast-food restaurants
all over.
But new census data suggest that without immigration, the county would
have had sharp population declines in this decade as tens of thousands
of residents left for other parts of the country.
New estimates of population released by the U.S. Census Bureau this
week say that Fairfield County lost almost 53,000 more residents to
other areas in Connecticut and other states than moved in from those
places between the 2000 Census and July 1, 2006. That loss was more
than double the combined net out-migration from the state's next two
largest counties, Hartford and New Haven.
But an influx of nearly 44,000 newcomers from Puerto Rico and foreign
countries helped the county eke out a scant 2 percent growth rate in
that time, lagging behind every other county except New London.
"One of the other things that's not well-known or appreciated in
Connecticut is the absolutely essential need for immigration into the
state," said Peter Gioia, vice president and economist at the
Connecticut Business and Industry Association. "Certainly you prefer
more highly skilled and trained people. But there's also a tremendous
need for support staff of all types. You can't drive down any street in
Fairfield County and not see `Help Wanted' signs all over the place."
One thing the census estimates don't make clear is where the new
residents are coming from. The bureau lumps arrivals from Puerto Rico
and foreign countries together under the heading "international
migration," although Puerto Ricans are U.S. citizens from birth.
Other demographic data, however, show that the Hispanic population of
Fairfield County, as in the rest of the state, has grown far more
quickly than the population as a whole. By July 1, 2005, the county had
become the most heavily Hispanic in the state, with about 128,500
residents, more than 14 percent, identified as Latino by the census.
According to the Census Bureau's 2005 American Community Survey, a
large-scale sampling of households distinct from the census population
estimates, that Latino population also was more diverse than elsewhere
in Connecticut.
Substantial majorities of Latinos in Hartford and New Haven counties -
about 70 percent and 61 percent, respectively - are of Puerto Rican
heritage, according to the survey.
In Fairfield County, the proportion of Puerto Ricans in the Hispanic
population is about 37 percent, with large communities of Ecuadorian,
Colombian, Guatemalan and other South and Central American immigrants.
They help give the county the highest proportion of foreign-born
residents in the state, about 18.5 percent, according to the survey.
The Rev. Richard Ryscavage, a sociology professor and head of the
Center for Faith and Public Life at Fairfield University, said that he
sees several reasons for the relative diversity of the Latino
population.
"Part of the difference has to do with the socioeconomic situation in
Fairfield County, which attracts a stronger diversity because there's
more diversity of employment opportunity," he said.
"Proximity to New York City is another factor," he added, with some
immigrants who first came to the city "resettling" in Fairfield County
and staying there to keep in touch with relatives.
The census also doesn't try to break out illegal immigrants, the
particular targets of anti-immigrant activists. It's difficult to find
reliable figures on the subject; the Pew Hispanic Center last year
estimated that 70,000 to 100,000 unauthorized immigrants live in the
state.
The broad category of international migration also buoyed the
population of the state as a whole between 2000 and 2006, especially
Hartford and New Haven counties. Both counties gained several thousand
more residents from international migration than they lost through what
the census calls "internal migration" to the rest of the nation.
But nowhere else in the state has the population been so shaped by
movements in and out of the county. The 53,000-person loss to internal
migration tallied by the Census Bureau represents almost 6 percent of
Fairfield County's population in 2000; the 44,000 gain from
international migration is nearly 5 percent.
Edward J. Deak, economics professor at Fairfield University, said that
both numbers seemed high, especially the internal migration number.
"You wouldn't have seen the vigor in the housing market for the period
'02 to '05 if there had been that kind of loss," Deak said.
The immigrants to the county would have to have high incomes to sustain
the housing market, he said, "and I just don't see that many people
working as bioresearch scientists, engineers, financial service people,
hedge fund employees, banking employees or something of that type."
Gioia, however, said that the figures are not surprising. Internal
migration - people leaving for destinations in the United States - in
part reflects the mobility of employees in large corporations and in
part the aging of an affluent population that chooses to retire
elsewhere.
The international migration, he said, is a product of the particular
geographic and economic situation of Fairfield County.
"It's the most diverse county ethnically, racially and otherwise in the
state," he said. "The proximity to New York City makes it a heck of a
lot easier for international migration, and there's an awful lot of
opportunity within the county."
Connecticut
Population Is Declining - 17,000 loss recorded in the last two years
DAY
By Associated Press
Published on 2/5/2007
Hartford (AP) — Connecticut is once again losing residents to other
states, ending a brief period of more robust population growth.
The state lost almost 17,000 more people than moved in between 2005 and
2006, according to the latest Census estimate. An influx of about
14,300 residents from Puerto Rico and foreign countries helped keep
Connecticut from a net loss in population, as happened in the early
1990s.
The Census Bureau estimates that Connecticut's population of 3.5
million grew by 4,108 in the year that ended last June 30. State
officials, who say the federal estimate understates the birthrate,
pegged the increase at more than 9,000.
The two numbers represent a continuing decline from annual growth
estimates in the mid-20,000 range from 2000 to 2003.
“The 2006 number was a confirmation of a significant trend,” said
economist Ron Van Winkle of West Hartford. “We may not see significant
growth in jobs or population in the state of Connecticut for the
foreseeable future.”
The Census estimate does not track the source or destination of people
coming and going, but data compiled by the Internal Revenue Service
indicate that the largest share — about 40 percent — of those who leave
Connecticut head for the South. The next most common destination is
elsewhere in the Northeast, followed by the West and Midwest.
Two age groups appear to be most severely affected by the declining
population growth: those who are in their late 20s and 30s and those
who are in their late 60s and 70s. Both groups dropped in number during
between 2000-2005.
Fairfield University economics professor Edward Deak said that for
workers in their prime earnings years, 35 to 55 or 60, Connecticut's
high cost of living is offset by the availability of well-paying jobs,
particularly in the financial and scientific areas.
“At the other two ends, as people retire they tend to leave the state,
and as young people graduate from college they find more attractive
opportunities for entry-level positions elsewhere,” he said.
The decline in the younger group also is due in part to what Van Winkle
called “a demographic wave” resulting from a drop in the birthrate
nationwide through the 1970s. It produced similar reductions in the
number of 20-somethings during the first half of the 1990s and in teens
a decade before that.
That demographic trend was more pronounced in Connecticut than in the
rest of the United States, Van Winkle said.
Economist Stephen Coelen, co-author of a report released last year
examining New England's work force in 2020, says the total working-age
population will probably decline in coming years in Connecticut and
most of the rest of New England. In addition, fewer young people
entering the work force will have four-year college degrees, he said.
“The situation for Connecticut and the whole Northeast is fairly dire,”
Coelen said.
Census: More
Of Us Than Ever: State Population Continues Growth, Exceeds 3.5
Million
December 22, 2004
By MIKE SWIFT, Courant Staff Writer
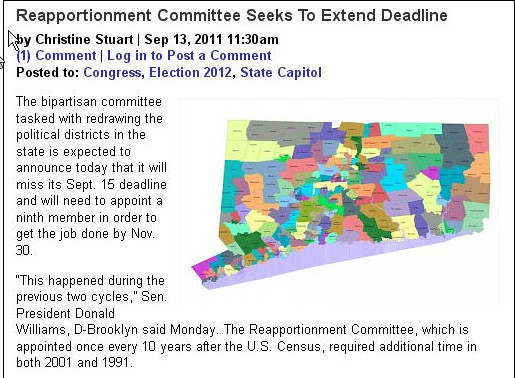
Connecticut's
population topped 3.5
million people for the first time in 2004, with the state adding nearly
as many people during the past four years as it added during the entire
1990s, the U.S. Census Bureau is reporting today.
Relative
to the previous three years,
Connecticut's growth slowed this past year, but the state still added
more
people than any of its New England neighbors and more even than much
larger
New York state, according to the new population estimates.
The
nearly 100,000 people that the
Census Bureau estimates that Connecticut added between 2000 and 2004 is
only 18,000 below the state's population growth between 1990 and 2000,
when Connecticut was one of the nation's slowest growing states.
During
the first three years of the
decade, between July 2000 and July 2003, the state added more than
20,000
people each year. The Census Bureau said that growth moderated during
the
past year, as Connecticut added roughly 16,600 people, a 0.5 percent
gain,
between July 2003 and July 2004.
That
population growth compared to
14,600 people in New York and 4,500 in Rhode Island. Massachusetts lost
about 4,000 people, making it the only state to suffer a population
decline
last year, according to the estimates.
"Connecticut
doesn't look like the
rest of New England," said Orlando Rodriguez, a demographic researcher
at the Center for Population Research at the University of Connecticut.
"It's not. It's more like New Jersey."
Connecticut's
gains, however, were
a fraction of those in the fastest growing states; Nevada added about
92,000
people in the past year, growing by 4.1 percent, the fastest percentage
growth in the nation.
Connecticut's
population gains are
being driven by the strong growth among Latinos and Asians, who
together
are accounting for much of the state's growth, census estimates
released
earlier this year show. Their gains are likely a combination of people
migrating to Connecticut from abroad and from other states,
particularly
the New York City area, as well as births in Connecticut, experts say.
"Connecticut
seems to be geographically
a good place [for Asians] because it is close to New York," said Angela
Rola, director of the Asian-American Cultural Center at UConn.
Aspects
of that growth include the
migration of ethnic Chinese to southeastern Connecticut casino jobs;
Asian
Indians drawn to Hartford County by medical and high-tech jobs, and
Filipinos
being attracted by health care jobs and the military, Rola said.
Less
clear within the state's new
population total was the meaning - and perhaps the accuracy - of the
new
federal estimates.
In
general, a growing population
is good news for a state's economy, reflecting the perception that
there
is economic opportunity in the places attracting people, and fueling
economic
growth. But the census estimates, which show solid population growth
during
the same years that the state is down 54,000 jobs, also raise a thorny
question:
"We
can't have a declining labor
force and a growing population. Generally, those two wouldn't go
together,"
said Ron Van Winkle, a West Hartford economist.
Van
Winkle said that during the 1990s,
the Census Bureau's population estimates - a statistical model based on
births, deaths and migration data - turned out to be lower than the
actual
population the agency counted in the 2000 Census. Most economic data,
he
said, suggest the bureau's estimates could be off the mark again, this
time in the opposite direction.
"Most
of the things you look at suggest
a population that is more stable, with small growth in it, rather than
one that would suggest robust growth," Van Winkle said.
With
the oldest of the Baby Boomers
approaching retirement, whatever population growth Connecticut is
enjoying
now may not last, said Edward J. Deak, an economics professor at
Fairfield
University.
"I
just don't see a lot of reason
for Connecticut even to be in the middle of the pack [among states] in
terms of population growth," Deak said.
By
percentage, New Hampshire remained
the fastest growing New England state, adding about 11,000 people last
year, a 0.8 percent jump - many of them apparently former Massachusetts
residents, experts said.
Migration
to neighboring New Hampshire
and Rhode Island is one cause of the population loss in Massachusetts,
said Steve Coelen, the former director of the Massachusetts Institute
for
Social & Economic Research.
Officials
in northeastern Connecticut
also say they have noted an influx of people from Greater Boston
seeking
lower housing prices south of the border.
That
migration, along with a slow
economy and the tightening of visa restrictions after 9/11 that may
make
it tougher for foreign students to enroll in Massachusetts
universities,
are all driving the Bay State's population drop, Coelen said.
"It's
not a surprise," Coelen said
of the census estimates.
Rodriguez,
the UConn population researcher,
said Connecticut is more like New Jersey than other New England states
because it has cities such as Hartford with intense poverty, and
because
of the more diverse ethnic and immigrant mix of two more-urbanized
states.
One
worrisome fact the Center for
Population Research uncovered in its analysis of the 2000 Census was
that
much of Connecticut's population growth was coming in poorer "urban
periphery"
towns such as Manchester and East Hartford.
If
that growth among poor people
has continued in the current decade, it's not good news, Rodriguez said.
"People
may say that [population
growth] means we're growing economically," he said. "Not necessarily.
It
could be a bad indicator."

Orlando Rodriquez final report on line (see below)
Statistics
Suggest Problems In Future For Connecticut; Glimpse of
state's population in 2030 shows aging, segregation
DAY
By Karin Crompton
Published on 5/16/2007
For the next 25 years, Connecticut's population will keep getting older
and more segregated, a state data center concludes in projections
released today.
The state will have fewer working-age people to support the glut of
baby boomers who will retire, and the state's minorities will continue
to be concentrated in a handful of urban areas while the rest of
Connecticut remains predominantly white.
Also, if not for an influx of foreign-born immigrants — other than
Hispanics — the state's population would shrink rather than grow. The
state's population growth, the center reports, is ranked among the
lowest in the country and puts the state at risk of losing seats in the
U.S. House of Representatives.
“The baby boomers didn't have enough kids to support them in
retirement, is what it boils down to,” said Orlando Rodriguez, manager
of the Connecticut State Data Center, which released the projections
today. “We need to make up the shortfall somewhere.”
The Connecticut State Data Center, created in 2006, serves as a liaison
to the U.S. Census Bureau. The state uses the data to create public
policy and to decide where to spend money.
Rodriguez, who said the information should ideally be published every
three to five years, said the information was previously collected by
the state Office of Policy and Management, which outsourced the job to
the Center. The population projections haven't been updated in 12 years.
The Center uses a figure called a “dependency ratio” that takes 100
workers and calculates how many people are dependent upon them. There
is a ratio for children and one for the elderly (those over 65).
The combination of the two is called a “total dependency” ratio. In
Connecticut, that number is projected to rise from 67 people dependent
upon every 100 workers in 2005 to 96 for every 100 in 2030.
Rodriguez looked up some figures for southeastern Connecticut.
“Whoa!” he yelped over the phone, clicking on the town of Lyme. Its
total dependency ratio is projected to reach 110 by 2030 — every 100
working people in Lyme will have to support 110 retirees.
But these are statistics, after all.
“This is a wealthy retirement community, so that may not mean
anything,” he said.
Overall, the state is projected to gain just three new residents for
every 1,000 existing residents annually until 2030. Locally, the
numbers foretell much the same. New London County's total population is
projected to grow at a rate of 0.02 percent by 2030, down from 0.20
percent in 2005.
Some of the more startling projections include:
• Sprague's median age, which was 43.2 in 2005, will climb to 65.9 in
2030
• Waterford's population drops from 18,303 in 2005 to 16,758 in 2030.
• East Lyme, considered a hub for 55-and-older housing, is projected to
see a decrease in the population's median age, from 43 in 2005 to 40.7
in 2030.
Rodriguez is quick to point out that the projections are different from
predictions.
“We look at the past and we do not take into account anything that will
happen in the future,” he said. “It's not an economic forecast — if the
(sub) base closes, they put in an Ikea, build 100 houses ... It's not
like that.”
Rodriguez said the data represents “one scenario. This may happen, not
that it will happen.”
•••••
The Center groups the state's 169 municipalities into five categories:
rural, suburban, urban core, urban periphery and wealthy. The
definitions for each category come from a combination of population
density (people per square mile), median family income and the
percentage of the population that falls under the poverty threshold.
Rodriguez concedes that the classifications are dated and need
updating. He said they were done three or four years ago and are based
on information from the 2000 Census.
That could explain why East Lyme is grouped in the rural category while
Salem falls into suburban. Rodriguez looked up the figures and said
East Lyme's population density is too low to be categorized as suburban
and its income is too high for the rural classification.
“You could say it's in transition,” he said.
New London is the only southeastern Connecticut city classified as an
urban center. Norwich and Groton are both considered urban periphery.
Extremely high population density is the primary characteristic for the
category, according to the Center.
While race was not used to determine categories, the Center concludes
that the state's minorities are most concentrated in the urban centers,
or “urban core” towns.
While the urban core classification accounted for 19 percent of the
state's population in 2000, the Center reports, more than half of the
state's blacks and Hispanics lived there. At the same time, more than
half of the state's white population lived in towns that were at least
90 percent white.
Statewide in 2000, 78 percent of towns were at least 90 percent white.
“I think one of the leading misconceptions is that Connecticut is a
racially diverse state,” said Rodriguez, who moved here from New
Orleans in 2002. “People say a quarter of the population is minorities
and it's the same nationwide. That may be true, but that quarter is
limited to seven towns in the state. So our minorities are segregated.”
The population projections can be seen at
ctsdc.uconn.edu/Projections-Towns/townList-css.html.
The town listings by category can be seen at http://www.ctsdc.uconn.edu/Projections-Towns/groups_5CTs.html
POPULATION PROJECTION IN
CT: What are the assumptions behind these numbers? See
below!
UCONN RESEARCH FOR CT: http://www.ctsdc.uconn.edu/Projections-Towns/groups_5CTs.html
| The calculations and assumptions
that form the basis for these population projections are drawn from
historical patterns of population change. Thus,
these projections reveal how populations may evolve over the next
twenty-five years - if these historical patterns continue to hold true. However, there is no guarantee that the
projected trends will occur. A host of
external influences, such as public policy initiatives at the state and
federal levels or significant shifts in economic structure, may lead to
new patterns of change in the population. |
Fairfield County population dwindling
ROB VARNON rvarnon@ctpost.com
Article Last Updated: 08/09/2007 09:47:28 PM EDT
More than 10,000 people moved out of Fairfield County, according to the
U.S. Census Bureau, which said Connecticut's largest county lost
population between 2005 and 2006.
For several years now, Fairfield County has relied on international
migration to overcome what would be a loss of population as people
moved out. But in 2006, 10,621 people left the county and only 6,584
immigrants from abroad moved in. The bureau tracks both domestic
migration, which covers U.S. citizens, and international migration,
which covers people of other nationalities.
"We would be concerned with a continuing loss," said Lisa Mercurio,
director of the Fairfield County Information Exchange. The exchange is
part of the Business Council of Fairfield County and it tracks
demographic and other trends that could affect the region.
The trend could exacerbate the problems businesses face in trying to
find employees.
Mercurio said the latest numbers, released Thursday, are a change from
previous years but it's only one year of data.
"In 2000 we were looking at a loss of 1,200," she said of domestic
migration, but about 2,000 immigrants settled in the county that year.
Now, to have more than 10,000 leave raises a number of questions, she
said, but added the census doesn't go into what's driving the changes.
"I would want to see a lot more of what's behind those numbers," she
said, before making any conclusions. However, Mercurio said policy
makers and business owners are aware of the need for more affordable
housing and transportation.
She also pointed out Fairfield County was not alone in its decline
between 2005 and 2006. The state's population also slipped during the
period, as did New Haven County's.
Donald Klepper-Smith, chief economist with New Haven-based DataCorps
Partners, said it shouldn't come as a surprise.
"Fairfield County is starting to lose its luster," he said. Despite
having the highest per-capita income in the nation, Klepper-Smith said
people are starting to question what's the worth of living in
communities with high taxes, high energy costs and bad traffic.
"There are other issues than earning a dollar," Klepper-Smith said.
Fairfield County's population stood at 900,440 in 2006 compared to
901,086 in 2005. The county's population is up compared to 2000, when
the bureau said it was 882,567.
New Haven County's population also showed a slight dip between 2005 and
2006 for similar reasons. Its population was 845,244 in 2006, compared
to 824,008 in 2000.
The bureau also released figures on race.
The populations of blacks, whites, Hispanics and Asians all increased
in Fairfield and New Haven counties between 2000 to 2006. Asians saw
the largest percentage increase as their population grew by 2.6
percent. Whites saw the smallest increase with 0.6 percent.
In New Haven, the Asian population increased by 42 percent and whites
by 0.2 percent. In both counties, whites remained in the majority.
Nationally, however, more counties reported that there was no race with
a majority, according to the census.
Of the nation's 3,141 counties, 303 now have all races in the minority.
That's an increase of eight since 2005.
Rob Varnon, who covers business, can
be reached at 330-6216.
Census Damage Control
NYTIMES
editorial
Published: June 23, 2008
Preparations for the 2010 census are a shambles.
Committees in the House have been holding hearings to vet the problems
and monitor progress. But with each hearing, it becomes more obvious
that prospects for a robust census are unlikely to improve considerably
unless and until the next president brings in new leaders. They are
needed at the Commerce Department, which includes the Census Bureau,
and at the bureau itself, which — like so many federal agencies — has
been mismanaged and demoralized during the Bush years.
Congress, in the meantime, has damage control to do. For starters,
lawmakers should pass a census funding bill for 2009, pending now in
the House, that includes a ban on the use of the bureau’s budget to
offer prizes to people for sending in their census forms. It’s morally
dubious — and bad public policy — to bribe people to do their civic
duty.
Also, research has shown that people who do not fill out their census
forms would be unlikely to fill out prize forms, too. Including a
sweepstakes with the census would invite errors, such as multiple
submissions. But all those well-documented negatives have not stopped
the Commerce Department from supporting the idea.
Lawmakers must also ensure that the final census funding bill includes
a provision from the House version that would require the bureau to
spend $8 million to $10 million of its budget on the Census in Schools
program. The program, which provides take-home materials to educate
families about the census, proved effective in reaching hard-to-count
populations during the 2000 census. But the House committee that
oversees the bureau learned last spring that the Commerce Department
planned to shrink the program.
The Census Bureau also announced earlier this month that it intends to
fingerprint its temporary work force of 500,000 census takers, a
logistical feat that will require hundreds of millions of dollars and
countless hours. The wisdom of fingerprinting is debatable. In the
past, the bureau has screened workers via F.B.I. name checks, but
obtained a waiver from the law that requires the fingerprinting of
federal employees. That was adequate to keep the public safe: in 2000,
four census employees were accused of crimes, but in all four cases the
charges were dropped or the accused acquitted.
Demands for public safety are perhaps louder now and that may argue for
better background checks. But what is not debatable is that a decision
to fingerprint should have been made years ago, and budgeted for
accordingly, in term of money and time. By leaving it until now, it
places a huge burden on an already strained process and seems intended
to strain it even further.
The quality of the nation’s democracy depends on the census, because
the numbers are used to decide the number of Congressional seats from
each state and hence the number of votes each state has in the
Electoral College. It’s hard to ignore the impression of partisan
motives in policies that hobble the census, because an inaccurate
census invariably undercounts out-of-the-mainstream groups not
typically aligned with Republicans.
Over the next several months, Congress can keep the census preparations
from deteriorating further. Come 2009, the next president and the next
Congress will have to give a new census team all the help it needs to
try to get the count firmly on track by 2010.
2010
Census: Who Should Count?
By
MICHAEL REGAN | Courant Staff Writer
September 30, 2007
Border states in America's South and West are battlegrounds in the
debate over illegal immigration, but when it's time to pass out seats
in Congress, they are beneficiaries as well, a new study says.
Because of their large populations of undocumented residents, Texas and
Arizona will each get one extra seat in the U.S. House of
Representatives after the 2010 Census, the Connecticut State Data
Center projects in a report being released today. California will keep
two seats it otherwise would have lost.
Overall, the South and West each stand to gain five seats in the House,
the center at the University of Connecticut says. If it weren't for
their populations of illegal immigrants, each of these regions would
gain only three.
The big loser in the reapportionment will be the Midwest, the center
says. Five states in that region are projected to lose a total of six
seats, four more than they would have if illegal immigrants were not
included in the census tally.
Connecticut, which lost a seat in the last reapportionment, should keep
the five it now has, but the Northeast as a whole will lose four - two
in New York and one each in Massachusetts and Pennsylvania.
There's more than congressional clout at stake in the reapportionment:
It also helps determine the makeup of the Electoral College. And the
census itself influences everything from federal aid to the makeup of
state legislatures. So as the 2010 Census approaches, attention is
turning to the issue of whether it's fair to continue counting illegal
immigrants.
Orlando J. Rodriguez, manager of the Connecticut State Data Center and
author of the new report, considered that issue when designing the
study. He figured the reapportionment two ways - one in which all
residents are counted, as is currently done, and one in which illegal
immigrants are factored out. Although politics watchers have been
handicapping the 2010 reapportionment almost since 2000 was completed,
Rodriguez said this is the first study he knows of to factor in the
immigration question.
In part, the shift expected in 2010 is the result of a long-term
population trend that has states in the South and West growing far
faster than states in the Northeast and Midwest. In the 1960s, the
Northeast and Midwest had 233 seats in the House, the South and West
202. The numbers roughly reversed two decades later, and now stand at
183 to 252. The new CSDC report projects that the South and West will
have 262 seats to 173 for the Northeast and Midwest after 2010.
The winners and losers don't fall strictly along regional lines. New
Jersey, for example, with the highest proportion of undocumented
workers in the Northeast, would lose one seat if illegal residents were
not counted, according to the CSDC projection. Montana would gain a
seat if they weren't counted. Louisiana, in the wake of Hurricane
Katrina, is expected to lose a seat regardless.
The new report suggests that the country's illegal immigrant population
is playing an increasing role in congressional apportionment. After the
2000 Census, an analysis by the Center for Immigration Studies found
that illegal immigrant populations affected the apportionment of four
seats. The CSDC report projects that six seats will be affected by
undocumented residents after 2010.
The projections are based on the most reliable data available,
Rodriguez said, but studying the undocumented residents population is
imprecise at best.
"Nobody really knows for sure," he said. "The bottom line is not `Is
this specifically going to happen?' What I was trying to get across is,
`Look at the impact [illegal immigration] is having.'"
Steven A. Camarota, director of research at the Center for Immigration
Studies, said the impact is cause for concern. "You can make a strong
case that there is a fundamental unfairness about this," Camarota said.
"You do raise competing questions of fairness, justice, one man-one
vote."
Counting illegal immigrants gives some voters disproportionate
political clout. For example, Montana, which missed out on an
additional seat after 2000 because of the weight of illegal immigrants
elsewhere and is projected to fall short again after 2010, had almost
650,000 registered voters last November and one representative in
Congress.
By contrast, California, which would lose two of its 53 seats after
2010 if illegal immigrants weren't counted, according to the
projections, has four districts each with fewer than 200,000 voters
registered. One district has fewer than 170,000 voters.
"You can win election [to Congress] in California with less than 50,000
votes," Camarota said.
But that's beside the point, said Arturo Vargas, executive director of
the National Association of Latino Elected and Appointed Officials. The
size of the electorate has nothing to do with representation in
Congress.
Members of Congress "are elected to represent constituents. They don't
just represent citizens," Vargas said. "They don't just represent the
people who vote for them. They represent everybody in that
congressional district."
Vargas said the framers of the Constitution drew distinctions among
various classes of residents at various points. When it came to
apportioning seats in Congress, he said, everyone was counted -
although slaves were only counted as three-fifths of a person. "Would
we go back to a time when we considered a person here to be less than
human, less than a whole person?" he said.
At a time when illegal immigration in general is under heightened
scrutiny, its connection to the census and reapportionment is likely to
get renewed attention. One question that has already come up is how
immigration enforcement might affect the count.
In 2000, the then-Immigration and Naturalization Service suspended
raids before and after the census so as not to deter undocumented
residents from responding. Earlier this year, when a census official
raised the possibility of a similar freeze in 2010, a spokesman for
Immigration and Customs Enforcement firmly ruled out the possibility.
Camarota and Vargas agreed that the question of what ICE does in 2010
depends on who is elected president in 2008.
"Under the unlikely circumstance that the Republicans win and they
institute a comprehensive enforcement strategy, who knows?" Camarota
said. "It could reduce the number of illegals significantly, and it
could reduce the response rate."
But Vargas said the Constitution charges the government with counting
everyone in the census.
"So the federal government needs to have some common sense about what
its other agencies are doing that is going to compromise its
constitutional duty to enumerate all persons," he said.
The other question is whether there will be renewed efforts to keep
undocumented residents - or all noncitizens - out of the
reapportionment count. Anti-illegal immigrant groups and states losing
representation have been unsuccessful in court over the issue in the
past, and Rep. Candice Miller of Michigan, which lost one seat after
2000 and is projected to lose another after 2010, has proposed a
constitutional amendment to limit the reapportionment count to citizens.
Margo J. Anderson, a professor of history at the University of
Wisconsin-Milwaukee and author of several books and papers on the
census and reapportionment, said it's hardly a new question.
"It's an old issue. It goes back to 1790," she said. "Every time there
is in some sense a political crisis in the country or a sectional
dispute, the communities that think they're not going to gain from it
take a hard look at it and wonder whether the rules are fair."
Committee
Will Tackle Congressional Districts Last
CT NEWSJUNKIE
by Christine Stuart | Sep 13, 2011 2:34pm
Posted to: Congress, Election 2012, State Capitol
The bipartisan Reapportionment Committee has gotten a lot of work done
since it started in April, but it admitted at it meeting Tuesday that
it won’t meet its Sept. 15 deadline. The laws governing the
committee dictate that the four legislative
leaders will need to be reappointed by Gov. Dannel P. Malloy, then they
will reappoint the four other lawmakers currently on the committee
before naming a ninth member.
They will have 30 days to appoint the ninth member. Sen. Minority
Leader John McKinney, R-Fairfield, said the committee’s
inability to reach a conclusion on how to draw the political districts
in the state is “not because of any partisan rancor or acrimony.”
“It’s just an enormous task and an incredibly important task,” McKinney
said.
Sen. Majority Leader Martin Looney, D-New Haven, agreed with McKinney’s
remarks and added that when it comes time for a ninth member to be
appointed he would like the committee to find someone who fit’s the
profile of the late Nelson Brown.
“Somebody who was extraordinarily well-respected by both parties, a
senior statesman, someone who understands the General Assembly,” Looney
said.
Brown had been appointed to the committee twice over the last few
decades as the ninth member, but he died last week at the age of
89.
House Minority Leader Lawrence Cafero, R-Norwalk, said he and House
Speaker Chris Donovan have talked about how the lines would be drawn
for “well over 100 districts.”
“And it is a very tedious and complicated process,” Cafero added.
Sen. President Donald Williams, D-Brooklyn, declined to say how many of
the 36 Senate districts he’s discussed with McKinney.
“I don’t anticipate we’ll be releasing districts in a piecemeal way,”
Williams said.
Donovan, who is also running for the open 5th Congressional District
seat, said the committee has been concentrating on the House and Senate
districts.
Five candidates in that race including Donovan live in border towns and
that district will have to lose at least 400 people. Asked if any
of the candidates need to worry about what the committee will decide,
Cafero joked, “we’ve cut all of them out.”
Donovan was quick to point out that the 5th district is only off by
about 400 residents, “that’s not a town.”
Looney said the Congressional districts will be like a domino moving
from east to west because it’s the 2nd Congressional district, which
takes up the eastern portion of the state, that will need to lose
population. He said that district will have to be reduce by about
15,000 whereas the other four Congressional districts are pretty close
to population.
Each Congressional district needs to include 714,819 this year and the
2nd Congressional District has a population of about 729,771 people,
according to U.S. Census data. Cafero said this year the
population growth has been in the northeast
corner of the state and the committee will be looking at shifting
districts from east to west in order to reach their constitutionally
mandated goals.
In trying to explain the process to his wife Cafero equated it to
hanging wallpaper.
“Too much glue in the upper right hand corner and you’re trying to push
this glue westward and southward. It’s tricky. Tricky stuff,” Cafero
said.
Rep. Arthur O’Neill, R-Southbury, said the committee has not addressed
the Congressional districts at all yet and have focused all of their
energy on the House and Senate seats.
“We had discussed many districts, but we really haven’t reached a final
conclusion,” O’Neill said. “We’ve done a lot of work so that when we
got to the commission phase it will go more quickly.”

A
Republican Bonus in 2012
The GOP is poised
to reap redistricting rewards.
Michael Barone, National Review
November 8, 2010 12:00 A.M.
Let’s try to put some metrics on last Tuesday’s historic election. Two
years ago, the popular vote for the House of Representatives was 54
percent Democratic and 43 percent Republican. In historic perspective,
that’s a landslide. The Democrats didn’t win the House popular vote in
the South, as they did from the 1870s up through 1992, but they won a
larger percentage in the 36 non-Southern states, as far as I can tell,
than ever before.
We don’t yet know this year’s House popular vote down to the last
digit, partly because California takes five weeks to count all its
votes (Brazil, which voted last Sunday, counted its votes in less than
five hours). But the nationwide exit poll had it at 52 percent
Republican and 46 percent Democratic, which is probably within a point
or so of the final number.
That’s similar to 1994, and you have to go back to 1946 and 1928 to
find years when Republicans did better. The numbers from those years
aren’t commensurate, though, since the then-segregated and Democratic
South cast few popular votes (blacks were effectively disfranchised,
and since the all-but-certain winner was chosen in the Democratic
primary, many southerners didn’t bother to vote in the general
election). So you could argue that this is the best Republican showing
ever.
Nationally, Republicans narrowly missed winning Senate seats in heavily
Democratic Washington and in Nevada and California, where less
problematic nominees might have won. As in all wave years, they missed
winning half a dozen House seats by a whisker (or a suddenly discovered
bunch of ballots).
But they made really sweeping gains in state legislatures, where
candidate quality makes less difference. According to the National
Conference of State Legislatures, Republicans gained about 125 seats in
state senates and 550 seats in state houses — 675 seats in total. That
gives them more seats than they’ve won in any year since 1928.
Republicans snatched control of about 20 legislative houses from
Democrats — and by margins that hardly any political insiders expected.
Republicans needed five seats for a majority in the Pennsylvania house
and won 15; they needed four seats in the Ohio house and got 13; they
needed 13 in the Michigan house and got 20; they needed two in the
Wisconsin senate and four in the Wisconsin house, and gained four and
14; they needed five in the North Carolina senate and nine in the North
Carolina house, and gained 11 and 15.
All those gains are hugely significant in redistricting. When the 2010
census results are announced next month, the 435 House seats will be
reapportioned among the states, and state officials will draw new
district lines in each state with more than one representative.
Nonpartisan commissions authorized by voters this year will do the job
in (Democratic) California and (Republican) Florida, but in most states
it’s up to legislators and governors (although North Carolina’s
governor cannot veto redistricting bills).
Republicans look to have a bigger advantage in this redistricting cycle
than they’ve ever had before. It appears that in the states that will
have more than five districts (you can make only a limited partisan
difference in smaller states), Republicans will control redistricting
in 13 states, with a total of 165 House districts, and Democrats will
have control in only four states, with a total of 40 districts. You can
add Minnesota (seven or eight districts) to the first list if the final
count gives Republicans the governorship, and New York (27 or 28
districts) to the second list if the final count gives the Democrats
the state senate.
When the Tea Party movement first made itself heard, House speaker
Nancy Pelosi dismissed it as “Astroturf,” a phony organization financed
by a few millionaires. She may have been projecting — those union
demonstrators you see cheering at Democratic events or heckling
Republicans are often paid by the hour to do so.
In any case, the depth and the breadth of Republican victories in state
legislative races, even more than their gain of 60-plus seats in the
U.S. House and six seats in the Senate, shows that the Tea Party
movement was a genuine popular upheaval of vast dimensions.
Particularly in traditional blue-collar areas, voters rejected longtime
Democrats or abandoned lifelong partisan allegiances and elected
Republicans.
This will make a difference, and not just in redistricting. State
governments face budget crunches and are supposed to act to help roll
out Obamacare. Republican legislatures can cut spending and block the
rollout.
“I won,” Barack Obama told Republican leaders seeking concessions last
year. This year, he didn’t.
Poll reveals baby boomers' retirement
fears
YAHOO
By ALAN FRAM, Associated Press
5 April 2011
WASHINGTON – Baby boomers facing retirement are worried about their
finances, and many believe they'll need to work longer than planned or
will never be able to retire, a new poll finds.
The 77 million-strong generation born between 1946 and 1964 has clung
tenaciously to its youth. Now, boomers are getting nervous about
retirement. Only 11 percent say they are strongly convinced they will
be able to live in comfort.
A total of 55 percent said they were either somewhat or very certain
they could retire with financial security. But another 44 percent
express little or no faith they'll have enough money when their careers
end.
Further underscoring the financial squeeze, 1 in 4 boomers still
working say they'll never retire. That's about the same number as those
who say they have no retirement savings.
The Associated Press-LifeGoesStrong.com poll comes as politicians face
growing pressure to curb record federal deficits, and budget hawks of
both parties have expressed a willingness to scale back Social
Security, the government's biggest program.
The survey suggests how politically risky that would be: 64 percent of
boomers see Social Security as the keystone of their retirement
earnings, far outpacing pensions, investments and other income.
The survey also highlights the particular retirement challenge facing
boomers, who are contemplating exiting the work force just as the worst
economy in seven decades left them coping with high jobless rates,
tattered home values and painfully low interest rates that stunt the
growth of savings.
"I have six kids," said Gary Marshalek, 62, of South Abington Township,
Pa., who services drilling equipment and says he has repeatedly
refinanced his home and dipped into his pension to pay for his
children's college. His inability to afford retirement "sounds like
America at the moment," Marshalek said. "Sounds like the normal instead
of the abnormal."
Marshalek was among the 25 percent in the poll who say they plan to
never retire. People who are unmarried, earn under $50,000 a year, or
say they did a poor job of financial planning are disproportionately
represented among that group.
Overall, nearly 6 in 10 baby boomers say their workplace retirement
plans, personal investments or real estate lost value during the
economic crisis of the past three years. Of this group, 42 percent say
they'll have to delay retirement because their nest eggs shrank.
Though the first boomers are turning 65 this year, the poll finds that
28 percent already consider themselves retired. Of those still working,
nearly half want to retire by age 65 and about another quarter envision
retiring between 66 and 70.
Two-thirds of those still on the job say they will keep working after
they retire, a plan shared about evenly across sex, marital status and
education lines, the survey finds. That contrasts with the latest
Social Security Administration data on what older people are actually
doing: Among those age 65-74, less than half earned income from a job
in 2008.
"I'm going to keep working after I retire, if nothing else for the
health care," said Nadine Krieger, 58, a food plant worker from East
Berlin, Pa. Citing $50,000 in retirement savings that she says won't go
far, she added, "We probably could have saved more, but you can't when
you have a couple of kids in the house."
About 6 in 10 married boomers expect a comfortable retirement, compared
with just under half of the unmarried. Midwesterners are most likely to
express confidence in their finances.
"I'm a good planner," said Robert Rivers, 63, a retired New York State
employee in Ravena, N.Y. He still works seasonally for the federal
government and collects a modest military pension. A recreational
pilot, he says he has scaled back his lifestyle by flying and driving
less.
"I'm spending money I have, not spending it and trying to repay it," he
said.
Among boomers like Rivers who plan to continue working in retirement,
35 percent say they'll do so to make ends meet. Slightly fewer cite a
desire to earn money for extras or to simply stay busy.
Excluding their homes, 24 percent of boomers say they have no
retirement savings. Those with nothing include about 4 in 10 who are
non-white, are unmarried or didn't finish college.
At the other end, about 1 in 10 say they have banked at least $500,000.
Those who have saved at least something typically have squirreled away
$100,000, with about half putting away more than that and half less.
Despite the worries and dearth of savings cited by many, only about a
third of boomers say it's likely that they'll have to make do with a
more modest lifestyle once they retire. Only about 1 in 4 expect to
struggle just to pay their expenses.
Financial experts say such expectations are often not realistic.
"Most families have to make a significant adjustment from their working
lives to their retirement years," said financial planner Sheryl
Garrett, who runs the Garrett Planning Network. Ads that show
silver-haired couples strolling off into the sunset do not represent
the typical retirement, she added.
The AP-LifeGoesStrong.com poll was conducted from March 4-13 by
Knowledge Networks of Menlo Park, Calif., and involved online
interviews with 1,160 baby boomers born between 1946 and 1964. The
margin of sampling error is plus or minus 3.5 percentage points.
Knowledge Networks used traditional telephone and mail sampling methods
to randomly recruit respondents. People selected who had no Internet
access were given it for free.

Click
above to UCONN study "The Five Connecticuts"